This article guides admins to VXT Analytics which gives a clear view of the team’s call activity. You can filter data, check trends, export reports, and even receive automatic email summaries — all from one easy dashboard.
In this article, we'll cover:
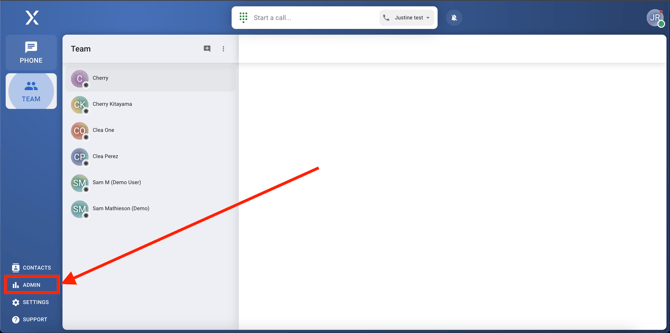
View analytics
-
Go to the Admin tab at the bottom left-hand corner of the screen.
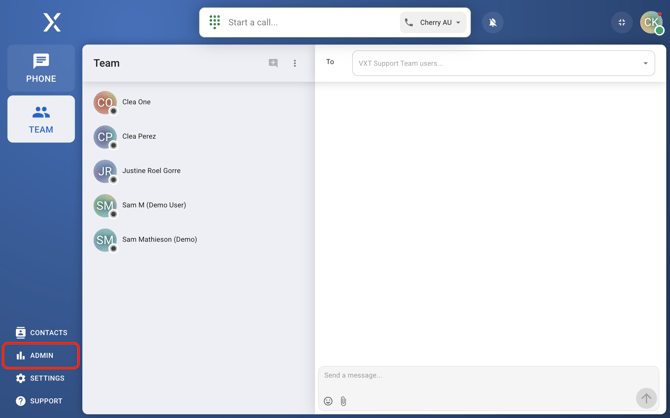
- Click on the Analytics tab.

-
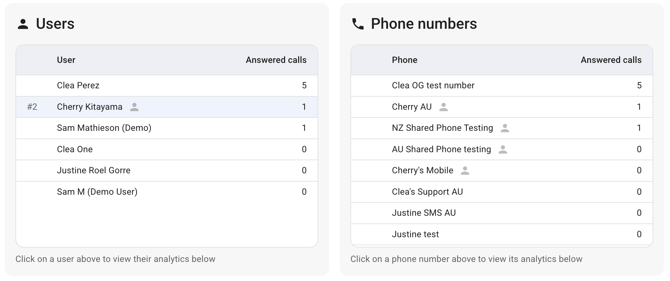
Information shown, depending on the categories selected, is grouped based on shared phone numbers or users.
-
Below this, there’s a graph that shows call patterns over time — super handy for spotting trends at a glance.
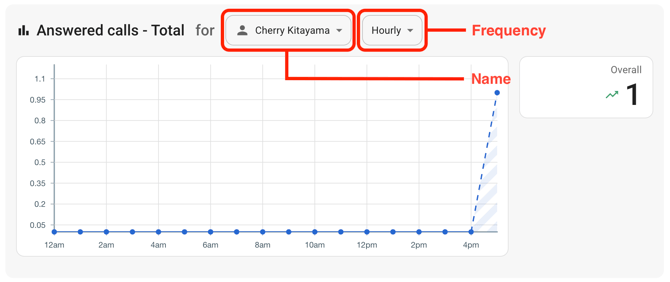
- Frequency - Track calls over time (Daily, Weekly, or Monthly)
- Name - Focus on a specific person, a team, or choose a user directly from the list.
-
Filtering call data
- Categories and Subcategories

-
- Choose a category that best represents the data you want to analyse.

- Answered calls- The total number of answered calls placed or received by users. Choose from the following subcategories for direction:
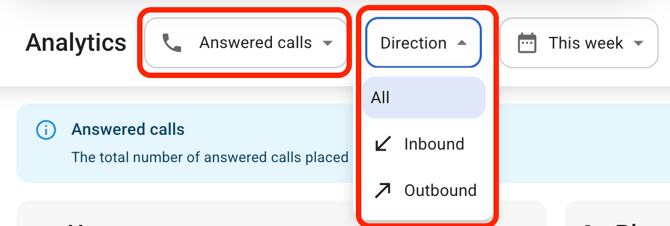
- Inbound- Answered calls received by users.
- Outbound- Answered calls placed by users.
- Call time- The total call time after a call is answered.
- Missed calls- Calls that weren't answered. Subcategories include:
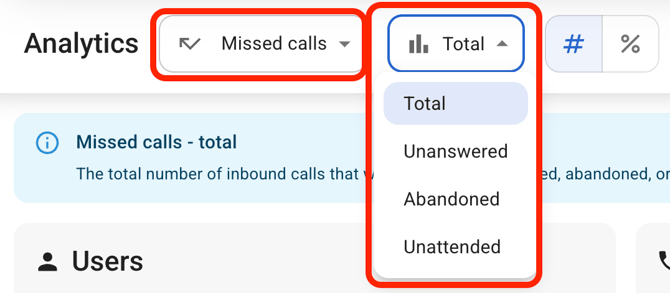
- Total- The total number of inbound calls that were missed (unanswered, abandoned, or unattended).
- Unanswered- The number of inbound calls that were missed or diverted after having rung a user for the full ring time (default 30 sec).
- Abandoned- The number of inbound calls where the caller hung up after a user had started ringing.
- Unattended- The number of inbound calls where the call flow did not ring a user. Calls that were diverted without ringing a user first are not tracked.
- Answered calls- The total number of answered calls placed or received by users. Choose from the following subcategories for direction:
- Choose a category that best represents the data you want to analyse.
2. Display by Absolute Number/Count (#) or by Percentage (%).
![]()
-
- Absolute Number (#)- exact counts
- Percentage (%)- helpful for spotting proportions or trends
3. Date Ranges
-
- Last 4 hours- Displays data from the most recent four-hour period.
- Today- Shows data collected from midnight to the current time.
- Yesterday- Includes all data from the previous calendar day.
- This Week- Covers data from the start of the current week (Monday) to today.
- Last Week- Displays data from the whole previous calendar week (Monday to Sunday).
- Last 30 Days- Analyzes trends over the past 30 days.
- All Time- Includes all available historical data.
- Custom- Allows selecting specific start and end dates for a more targeted analysis.
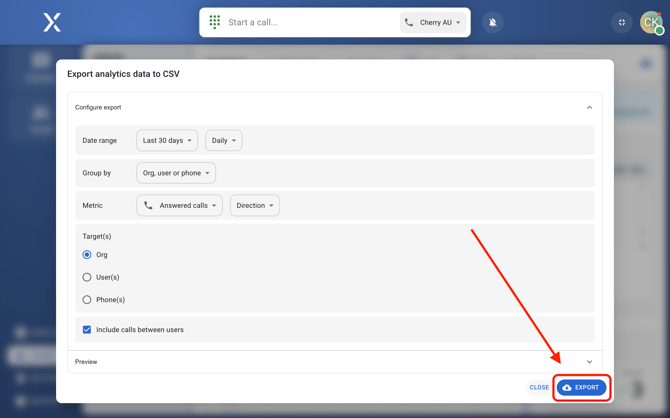
Exporting data
-
Click on the Export button in the top right.

-
Select the configuration of the data and click 'Export' to save the data into a CSV file.
Getting Analytics Reports by Email
-
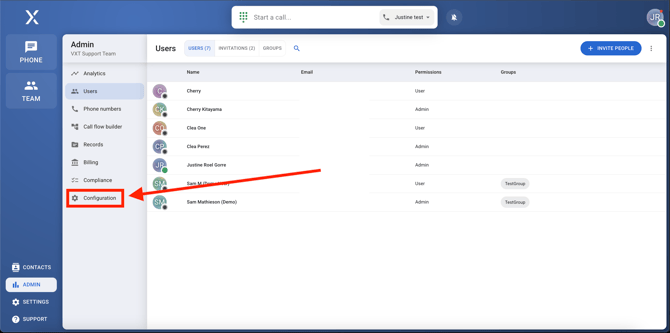
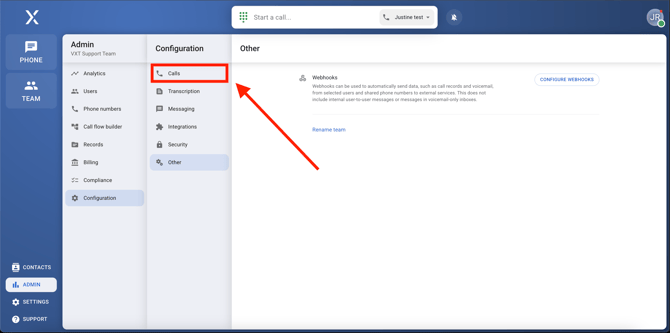
Go to Admin.
-
Click Configuration.
-
Open the Calls tab.
-
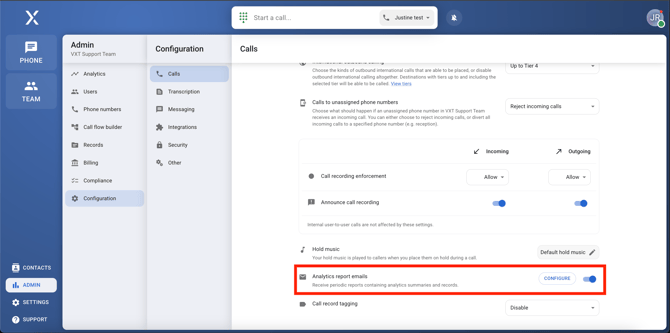
Scroll to Analytics Report Emails.
-
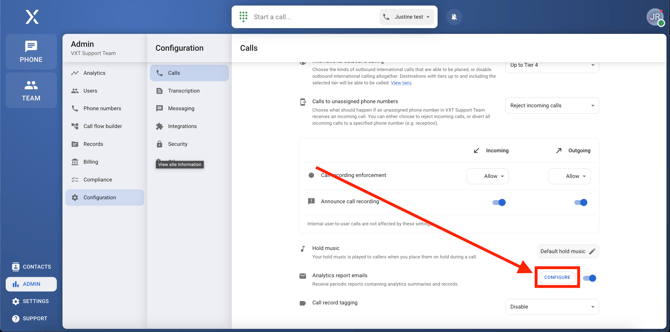
Click Configure.
- Choose how often reports are sent (daily, weekly, etc.).
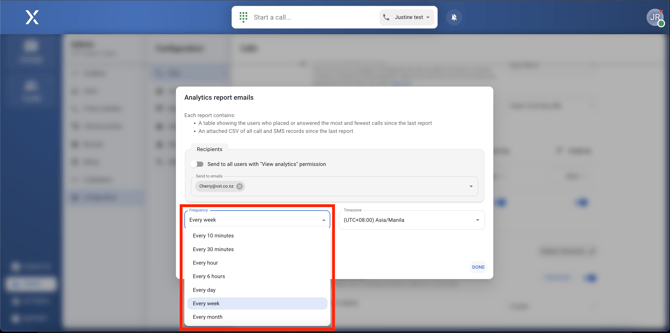
- Add the email recipients.
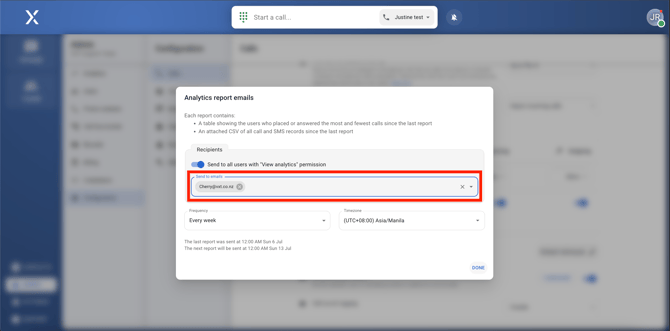
- Set the time zone.
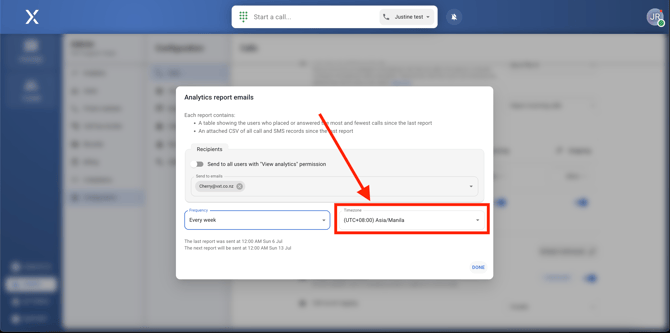
- Click Done, and make sure the feature is turned ON
That’s it! Your reports will now be sent out automatically according to your preferences.